What’s in a Wordle?
Provost Learning Space - DH Project
Dr.
Marina Nechayeva, MEC
Course:
Intro
to Statistics - Hybrid
Enrollment: 19. Attending: 17. Participated: 14
Issue:
A
large number of students that enroll in Hybrid courses ‘do not belong”.
Idea:
Assignments
such as this one can be used to diagnose the extent to which a student will
thrive in a hybrid (statistics) course. For example, such an assignment may be a component of the (online) screening
given to students prior to granting permission to enroll in a
hybrid section.
Rational:
To
complete this assignment a student needs to possess a degree of study,
communication, quantitative reasoning and technological skills.
Does
data support this? Yes, BIG time!
Project
Outline (as provided to students)
·
Find online (or
elsewhere) the complete lyrics of your favorite
song (in any western language) and save these in a plain text file format.
Make sure to have all repetitions (of chorus etc) explicitly typed. Using Firefox or Safary browsers, go to the
website www.wordle.net and follow
instructions to create a Wordle of
you favorite song. Save the image of your Wordle (for example, as a screenshot)
on your computer.
·
Post the image of your Wordle on Piazza (Q&A) page.
·
Email the lirics
and your wordle image to mnechayeva@ lagcc.cuny.edu together with an answer to the following question "What statistical information
about the lyrics of your favorite song is visualized by the Wordle, in what
way?"
Demo:


E
It
visualized the true meaning of the lyrics by its variation of color.
V
The
different colors of the words helps to organized them. The visualizations provided
on Many Eyes range from the ordinary to the experimental. therefore base in the
information obtained we can create a data format and style.
A
I
can see this Wordle as a
continuous
or a discreet problem
J Answer: The entire song/Lyrics created by
wordle contains 70 words, 30 Red, 23 Green, 17 Blue.
a) What is the probability that the two
randomly selected words are red? 0.180
b) What is the probability that the first
word selected is Red and and the second Green? 0.143
c) What is the probability that the first
word selected is Green and the second Red? 0.143
d) What is the probability that one word is
Red and the other Green? 0.286
D
Wordle displays the frequency of
each word in the song I chose by rap
artist - Drake in his number one
billboard single "Hold on we're going
home." From the chart we can
see that he used the words "I", "home",
"going" and
"you" numerous times throughout the song.
(link to lyrics -
http://www.azlyrics.com/lyrics/drake/holdonweregoinghome.html)
C
QUESTION: This Wordle is an example
of a word- frequency graph.
Statically, the words in the lyrics
that are repeated the most for example, the song is called "Enjoy the
Ride", the chorus' repeats enjoy the ride several times, the words are
bigger and the words that are repeated few times are much smaller.
A
Question: the statistical
information about the lyrics of my favorite song
is visualized by Wordle in the way
that how ever many times a certain word
is said in the song affects how big
the word will come out in the Wordle
image. if the word is mentioned a
lot in the song, then it will be larger
then the other words, and if a word
is barely mentioned in the song then it
will be smaller then the rest of the
words on the Wordle image.
A
Word wordle's are a way to see a large
text. It is a way to see the frequency of words within the text.The statistical
information my wordle shows me is the words that are bigger then the others are
the ones that are the most repeated within the song.
S
A:
The size of the words are based on their frequency of appearing in the lyrics,
the higher frequency the word repeated, the bigger the word appears in the
picture
J
Answer: Wordle counts the frequency of words provided
(song lyrics) and scrambles them into an artistic picture. As the frequency of
a word increases, so does the size of the word.
|
|
date
|
Piazza post
|
format
|
question
|
score
|
HW completed (out of 6)
|
Average quiz
score
|
adjusted
|
|
1
|
5/2
|
1=Image (upside down)
|
N(note)
|
0=none
|
1.5
|
0
|
0
|
0
|
|
2
|
5/2
|
2=image
|
Q(question)
|
0=wrong
|
2
|
4
|
50
|
33
|
|
3
|
5/2
|
3=image+help
|
Q
|
2=right, but not using terminology
|
5
|
6
|
89
|
89
|
|
4
|
5/2
|
1=Png File link
|
Q
|
1=off, but creative
|
2
|
6
|
76
|
76
|
|
5
|
5/3 and 6
|
1=Image sm
And URL
|
Q
|
1=right, not developed
|
2
|
4
|
51
|
34
|
|
6
|
5/4
|
2=image
|
N
|
2=right, but not using terminology
|
4.5
|
6
|
79
|
79
|
|
7
|
5/4
|
2=image
|
N
|
3
|
5.5
|
5
|
90
|
75
|
|
8
|
5/5
|
1=Image sm
|
Q
|
0=wrong
|
1
|
4
|
63
|
42
|
|
9
|
5/5
|
2=image
|
Q
|
3
|
5
|
6
|
94
|
94
|
|
10
|
5/5
|
1=Jpg File link
|
Q
|
0=NA
|
1
|
5
|
83
|
69
|
|
11
|
5/6
|
1=Jpg File link
|
Q
|
3
|
4
|
6
|
74
|
74
|
|
12
|
5/6
|
2=Image
|
FN (follow up)
|
2=right, not fully developed
|
4.5
|
NA
|
NA
|
0
|
|
13
|
5/6
|
0=URL
|
Q
|
0=wrong
|
0
|
0
|
0
|
0
|
|
14
|
5/6
|
0=URL
|
Q
|
0=none
|
0
|
5
|
55
|
46
|
|
15
|
_
|
|
|
|
0
|
4
|
73
|
49
|
|
16
|
_
|
|
|
|
0
|
3
|
73
|
37
|
|
17
|
_
|
|
|
|
0
|
6
|
80
|
80
|
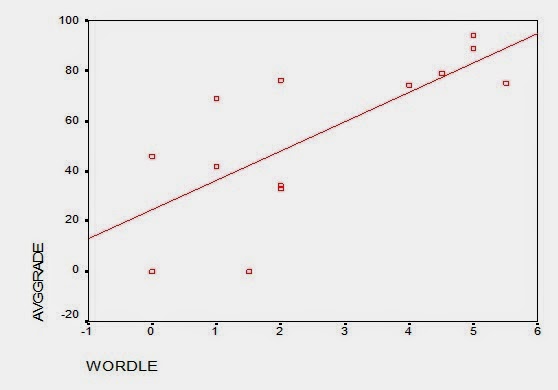
Conclusion:
A degree to which a student has succeded with the wordle assignment (as judged
by rubrics) is strongly predictive of his/her success in a hybrid statistics
course (measured in terms of assignment completion and average score by week 8
of the cource).
Correlation between score on a wordle assignment
|
|
|
WORDLE
|
AVGGRADE
|
|
WORDLE
|
Pearson Correlation
|
1
|
.732(**)
|
| Sig. (2-tailed) |
.
|
.004
|
|
| N |
13
|
13
|
|
|
AVGGRADE
|
Pearson Correlation
|
.732(**)
|
1
|
| Sig. (2-tailed) |
.004
|
.
|
|
| N |
13
|
13
|
**
Correlation is significant at the 0.01 level (2-tailed).
Great
Side effects!!!
Increased
engagement in online participation in weeks following the administering of the
assignment.


Further
Analyses:
It appears that all 4 skill types (study,
communication, QR and tech) are strongly related!
Proposal:
Develop
an online diagnostic tool for students interested in taking Hybrid
Develop and utilize assignments such as this
one to screen and advise students (not just in Statistics courses, but all courses
tapping into QR, Critical Thinking and problem solving)